Middleware Monitoring with Kafka & Redis: SRE Best Practices
Middleware components are defined as intermediate software layers existing between an application and its network or database layer. These entities serve as mediators that let various parts of a distributed application to fully communicate with each other; it offers both basic services and functionality.
Apache Kafka and Redis are also among the important components of middleware (if we consider position in an architecture). Kafka is a type of message-oriented middleware but as a message broker it enables real time bidirectional messaging between systems in a publish-subscribe manner, Redis can be categorized as Database middleware, because Redis provides the high-speed in-memory data storage, and It operates as intermediary level between the application and database, where data can be processed and/or cached. This blog will delve into the best practice for monitoring Kafka and Redis by focusing on Site Reliability Engineering (SRE) principles.
Why monitor Kafka and Redis?
Kafka and Redis play an important role in distributed systems, and they are strongly associated with the reliability of a system.
Monitoring ensures:
System Reliability: The identification of a potential bottlenecks or failures at an early stage of the either system.
Performance Optimization: Helps to understand the workload patterns to fine-tune configuration.
Scalability Planning: Metrics relating to utilization of resources, helps in capacity planning.
Operational Efficiency: The ability to reduce the down time of an application by having proactive alerts and analysis.
Effective monitoring of both systems is important to ensure optimal functionality, maintain application reliability, identify and troubleshoot issues efficiently.
Unlocking Insights: Critical Metrics for Observability
Kafka Metrics
Broker Metrics:
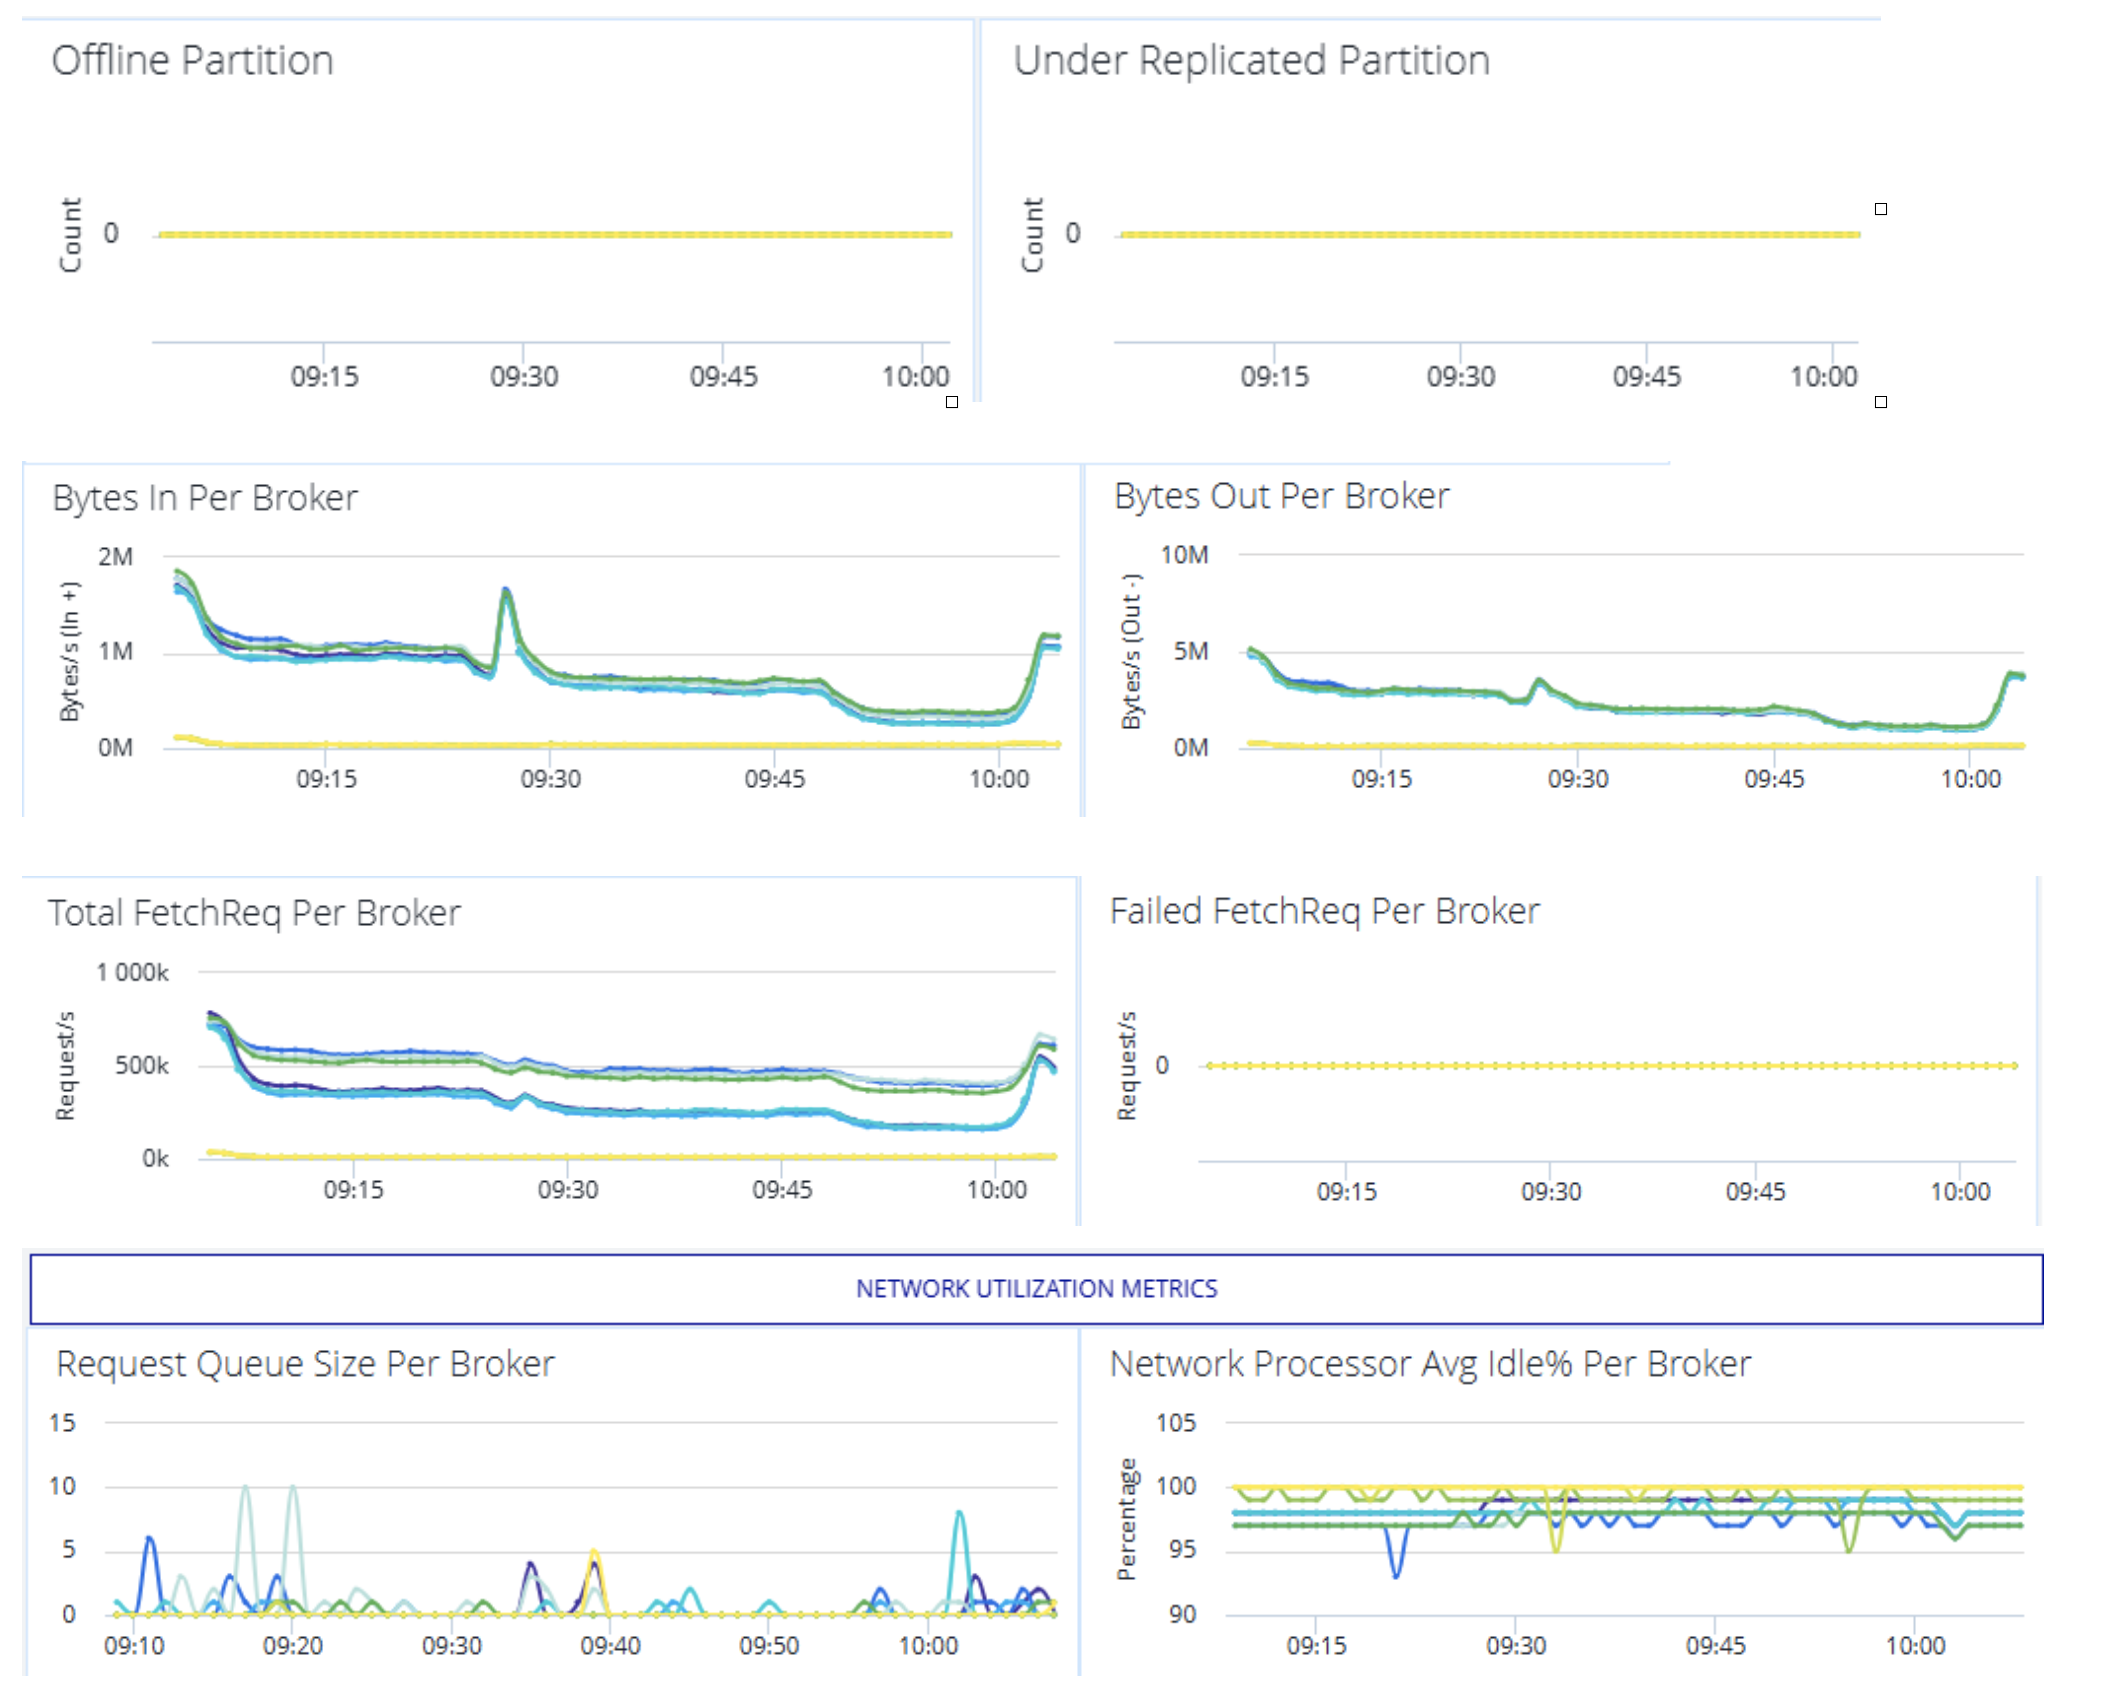
BytesInPerSec / BytesOutPerSec / MessagesInPerSec: Message and data throughput per second; critical for SLIs.
Evicted / Expired Keys: High numbers = memory limits reached.
Rejected Connections: Signals resource saturation or config issues.
Slow Logs: Commands exceeding threshold time = latency alerts.
Connection Metrics:
Active Connections: Current client connections in use.
Blocked Connections: Waiting due to internal ops; increasing trend = long-running ops.
Rejected Connections: Connection attempts failed, usually due to DB issues.
Logs and Trace monitoring
While metrics help with high-level monitoring, traces and logs provide the fine-grained information necessary to debug production level problems in Redis and Kafka.
Why Instrument Logs and Traces?
Logs provide root-cause insight during failures (e.g., authentication issues, timeouts, unresponsive nodes).
Traces capture end-to-end flows, which can be beneficial in distributed systems for identifying where delays or loss of data is occurring
These can be exported to centralized logging systems like Splunk, ELK, or Grafana Loki, and correlated with metrics.
Kafka & Redis Log Instrumentation
Both Kafka and Redis generate detailed logs that are essential for diagnosing system issues beyond what metrics can show
Kafka components produce logs that help trace system behavior,such as:
The different log levels (INFO, WARN, ERROR) can be used and filters to extract meaningful patterns.
Centralized logging can be configured using syslog, Filebeat, or Logstash to send logs to tools like ELK or Loki for analysis and visualization.
Tracing with OpenTelemetry
Kafka producers/consumers and Redis clients can be instrumented with OpenTelemetry to generate traces. This allows
Tracking a message from producer → broker → consumer
Linking Redis calls to upstream services in distributed traces
Detecting slow segments in the message pipeline
Use OpenTelemetry SDKs (e.g., Java, Python) to auto-instrument any application code. Export spans/traces to Jaeger, Tempo, or Zipkin.
Composite Alerting
A Composite Alert in observability platform refers to an alert that is triggered based on combination of several alert conditions (from different metrics, logs, or traces). Instead of having alerts for individual metrics. Composite alerts allow users to create logical conditions with multiple metrics (such as AND, OR) that must be satisfied before an alert is triggered, helps in reducing noise and false positives.
Key Features of Composite Alerts:
Combines multiple Alerts: It makes decision based on multiple individual alerts (e.g., CPU usage, response time, and error rate) and triggers a high-level alert only when several underlying metrics/alerts meet specific conditions.
Logical Conditions: Uses AND/OR conditions to define rules among multiple individual metrics
Trigger alert if Alert A AND Alert B are both active
Trigger alert if Alert A OR Alert B is active.
Alert noise reduction: Helps in preventing unnecessary alerts by ensuring only critical alerts triggered based on the conditions.
Contextual correlation: Helps to correlate issues across different services or metrics to detect the actual incidents instead of isolated spikes, and we can define how long a condition must persist before triggering using custom time windows.
Composite alert list for Kafka:
Composite Alert/Health Rule
Metrics considered
Warning Threshold
Critical Threshold
Kafka-Controller This composite alert is a grouping of Kafka controller related metrics
Active Controller count
If not 1
Consistently 0 (no active controller)
PartitionCount
Less than specific number (based on the setup)
Less than specific number (based on the setup)
Kafka-JVM This composite alert is a grouping of Kafka JVM Memory related metrics
Non-Heap Memory Usage – Used
Above 70% of allocated memory
Above 85% of allocated memory
Heap Memory Usage – Used
Above 75% usage
Above 85% usage
Kafka Server-Load This composite alert is a grouping of Kafka IN/OUT Load related metrics
BytesInPerSec
Based on actual traffic baseline
Based on actual traffic baseline
BytesOutPerSec
Based on actual traffic baseline
Based on actual traffic baseline
TotalProduceRequestsPerSec
Based on actual traffic baseline
Based on actual traffic baseline
TotalFetchRequestsPerSec
Based on actual traffic baseline
Based on actual traffic baseline
FailedFetchRequestsPerSec
Above 1
Above 5
FailedProduceRequestsPerSec
Above 1
Above 5
Kafka Server-Partitions This composite alert is a grouping of important Kafka Partitions related metrics
IsrExpandsPerSec
Above 1
Above 5
IsrShrinksPerSec
Above 1
Above 5
UnderReplicatedPartitions
Above 0
Persistent increase (Above 5)
OfflinePartitionsCount
Greater than 0
Consistently increasing (Above 5)
Kafka Network This composite alert is a grouping of Kafka Network related metrics
NetworkProcessorAvgIdle%
Below 30%
Below 10%
RequestQueueSize
Above 50 requests
Above 100 requests
Composite Alert list for Redis:
Composite Alert/Health Rule
Metrics considered
Warning Threshold
Critical Threshold
Redis_Memory Utilization This composite alert is a grouping of all Redis memory related metrics
Peak used memory
Above 80% of max memory
Above 95% of max memory
Mem_fragmentation_ratio
Greater than 1.5
Greater than 2.0
Used_memory_rss
Above 80% of max memory
Above 95% of max memory
Redis_CPU Utilization This composite alert is a grouping of all Redis CPU related metrics
Used_cpu_user
Greater than 75% usage
Greater than 90% usage
used_cpu_sys
Greater than 75% usage
Greater than 90% usage
Redis_Connection Metrics This composite alert is a grouping of all Redis Connection related metrics
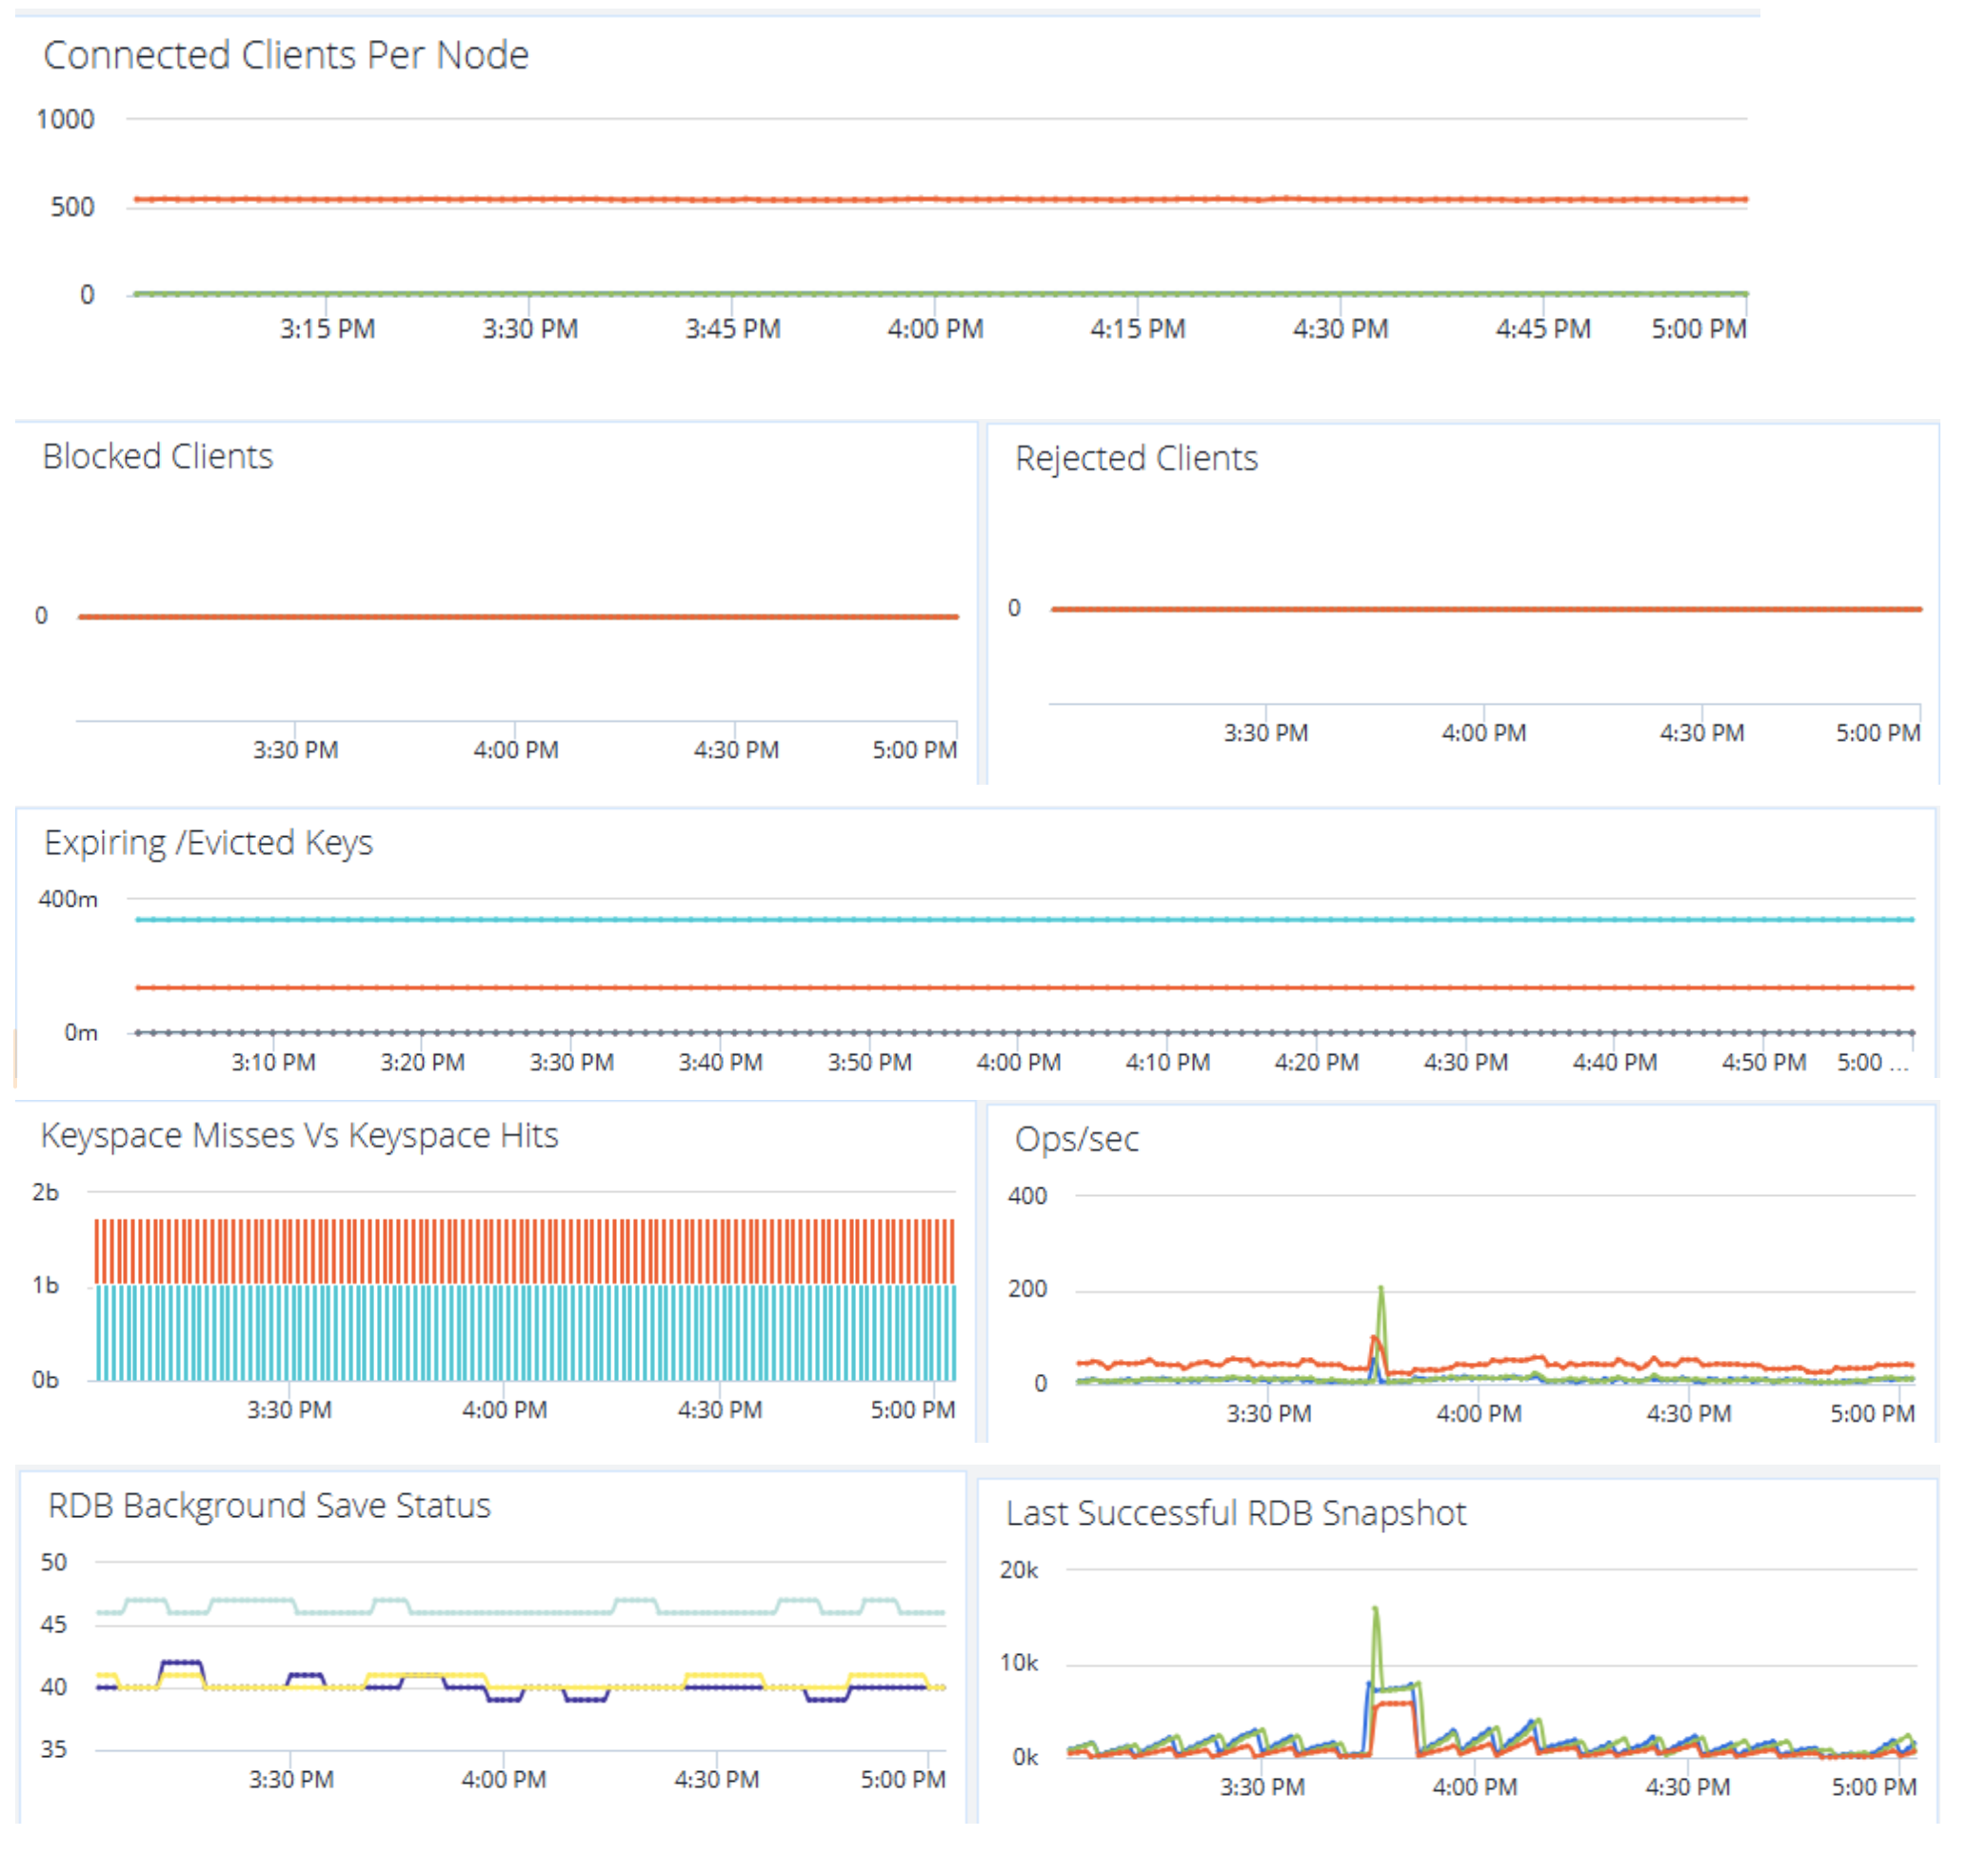
Rejected connections
Above 100
Above 500
Connected client
Above 80% of max connections
Above 90% of max connections
Blocked clients
Above 10% of active clients
Above 20% of active clients
Redis_Keyspace Metrics This composite alert is a grouping of all Redis Keyspace related metrics
Expired/Evicted Keys
Above 100
Above 500
Slow_log
Above 100
Above 200
Cache_hit_ratio(%)
Below 80%
Below 70%
Note: Threshold values vary based on actual traffic and data volumes.
Custom Dashboarding
There are third party extensions available for exposing custom metrics for Kafka and Redis. Once these are exposed, they’re not just raw numbers they become actionable insights when visualized through custom dashboards.
With Kafka and Redis extensions, we can collect detailed internal metrics from each component like brokers, producers, consumers, Broker, memory usage, persistence events, and more. These extensions push the data to monitoring platforms like AppDynamics, Grafana, or Prometheus, where they are transformed into live dashboard widgets.
Benefits of having Dashboards:
Centralizes visibility: See critical Kafka and Redis metrics briefly—partition health, lag, connection saturation, memory usage, etc.
Enables proactive alerting: Threshold-based alerts can trigger email, Slack, or Ops tools when anomalies occur (e.g., lag spikes, node failures, replication issues).
Accelerates troubleshooting: Real-time visual feedback helps identify issues before they impact users—like memory fragmentation or under-replicated partitions.
Reduces MTTR: Alerts backed by visual context help team to react faster and smarter during incidents which also helps to resolve them quicker.
Supports capacity planning: Historical graphs of throughput, latency, and memory trends reveal scaling needs.
Kafka Metrics dashboard:
Redis metrics dashboard:
Conclusion
Monitoring middleware components is critical and a continuous process that evolves with system/application requirements. By focusing critical metrics, Logs and Traces, utilizing the right tools and having an insightful dashboards and meaningful alerts, we can make resilient and high performing distributed system. These practices grounded in , enable teams to proactively manage incidents, meet SLA’s and maintain application reliability.
Altimetrik is committed to protecting your personal information. To apply for a position, you will need to provide your email address and create a login. Your information will be used in accordance with applicable data privacy laws, our Privacy Policy, and our Privacy Notice.